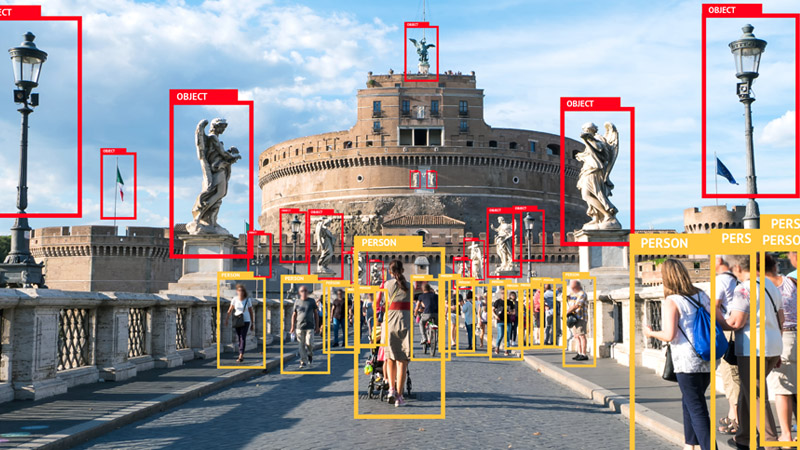
Creating Computer vision datasets
How to create a new novel datasets from a few set of images.

knowledge Graphs are a way to visualize relationships between entities, they can be helpful in visualizing a relationship and making it simpler to understand.
the data used is collection of sentences extracted from wikipedia.
import re
import pandas as pd
import spacy
from spacy import displacy
nlp = spacy.load('en_core_web_sm')

from spacy.matcher import Matcher

import networkx as nx

import matplotlib.pyplot as plt
from tqdm import tqdm

pd.set_option('display.max_colwidth', 200)
%matplotlib inline
df = pd.read_csv("https://raw.githubusercontent.com/phgunawan/Latihan-ML/master/wiki_sentences_v2.csv")
df
| sentence | |
|---|---|
| 0 | confused and frustrated, connie decides to leave on her own. |
| 1 | later, a woman’s scream is heard in the distance. |
| 2 | christian is then paralyzed by an elder. |
| 3 | the temple is set on fire. |
| 4 | outside, the cult wails with him. |
| ... | ... |
| 4313 | confidencial also responded negatively, calling the film a barren drama, unsubtle and self-indulgent. |
| 4314 | and le parisien gave the film their highest five-star rating. |
| 4315 | the museum collection includes 37,000 film titles, 60,000 posters, 700,000 photographs and 20,000 books. |
| 4316 | its predecessor was the dutch historical film archive, founded in 1946. |
| 4317 | , 1920'sfilmstar greta garbo by alexander binder, |
4318 rows × 1 columns
# detect dependencies
doc = nlp(df['sentence'][0])

print(f"{'Token':20}Dependency")
print('=' * 30)
for token in doc:
    print(f"{token.text:20}{token.dep_}")
Token               Dependency
==============================
confused            advcl
and                 cc
frustrated          conj
,                   punct
connie              nsubj
decides             ROOT
to                  aux
leave               xcomp
on                  prep
her                 poss
own                 pobj
.                   punct
def get_entities(sent):
    """
    extract the subject and the object (entities) from a sentence while also overcoming the challenges faced by spacy.

    Parameters
    ----------
    sent: string
        Sentence to get entities for.

    Returns
    -------
    List
        list containing subject and object.
    """
    ## chunk 1
    ent1 = ""
    ent2 = ""

    prv_tok_dep = ""    # dependency tag of previous token in the sentence
    prv_tok_text = ""   # previous token in the sentence

    prefix = ""
    modifier = ""

    for tok in nlp(sent):
      ## chunk 2
      # if token is a punctuation mark then move on to the next token
      if tok.dep_ != "punct":
        # check: token is a compound word or not
        if tok.dep_ == "compound":
          prefix = tok.text
          # if the previous word was also a 'compound' then add the current word to it
          if prv_tok_dep == "compound":
            prefix = prv_tok_text + " " + tok.text

        # check: token is a modifier or not
        if tok.dep_.endswith("mod") == True:
          modifier = tok.text
          # if the previous word was also a 'compound' then add the current word to it
          if prv_tok_dep == "compound":
            modifier = prv_tok_text + " " + tok.text

        ## chunk 3
        if tok.dep_.find("subj") == True:
          ent1 = modifier +" "+ prefix + " " + tok.text
          prefix = ""
          modifier = ""
          prv_tok_dep = ""
          prv_tok_text = ""

        ## chunk 4
        if tok.dep_.find("obj") == True:
          ent2 = modifier + " " + prefix + " " + tok.text

        ## chunk 5
        # update variables
        prv_tok_dep = tok.dep_
        prv_tok_text = tok.text

    return [ent1.strip(), ent2.strip()]
df['sentence'][5]
"it's a parable of a woman's religious awakening—"
get_entities(df['sentence'][5])
['it', 'religious awakening']
entity_pairs = []

for i in tqdm(df["sentence"]):
  entity_pairs.append(get_entities(i))
100%|██████████| 4318/4318 [00:38<00:00, 111.34it/s]
def get_relation(sent):
    """
    Get relation between sentence entities.

    Parameters
    ----------
    sent: string
        Sentence to get relations for.

    Returns
    ------
    string
        Relations in sent.
    """

    doc = nlp(sent)

    # Matcher class object
    matcher = Matcher(nlp.vocab)

    #define the pattern
    pattern = [{'DEP':'ROOT'},
                {'DEP':'prep','OP':"?"},
                {'DEP':'agent','OP':"?"},
                {'POS':'ADJ','OP':"?"}]

    matcher.add("matching_1", None, pattern)

    matches = matcher(doc)
    k = len(matches) - 1

    span = doc[matches[k][1] : matches[k][2]]

    return(span.text)
relations = [get_relation(i) for i in tqdm(df['sentence'])]
100%|██████████| 4318/4318 [00:37<00:00, 115.69it/s]
# building the graph
# extract subject
source = [i[0] for i in entity_pairs]

# extract object
target = [i[1] for i in entity_pairs]

kg_df = pd.DataFrame({'source' : source, 'target' : target, 'edge' : relations})
kg_df
| source | target | edge | |
|---|---|---|---|
| 0 | connie | own | decides |
| 1 | later woman | distance | heard in |
| 2 | christian | then elder | paralyzed by |
| 3 | temple | fire | set on |
| 4 | outside cult | him | wails with |
| ... | ... | ... | ... |
| 4313 | confidencial | negatively film | responded |
| 4314 | le parisien | five star rating | gave |
| 4315 | museum collection | 37,000 film titles | includes |
| 4316 | predecessor | historical film 1946 | was |
| 4317 | 1920'sfilmstar alexander binder | garbo by |
4318 rows × 3 columns
# create a directed-graph from a dataframe
graph = nx.from_pandas_edgelist(kg_df, "source", "target",
                          edge_attr=True, create_using=nx.MultiDiGraph())
plt.figure(figsize=(12,12))

pos = nx.spring_layout(graph)
nx.draw(graph, with_labels=True, node_color='skyblue', edge_cmap=plt.cm.Blues, pos = pos)
plt.show()
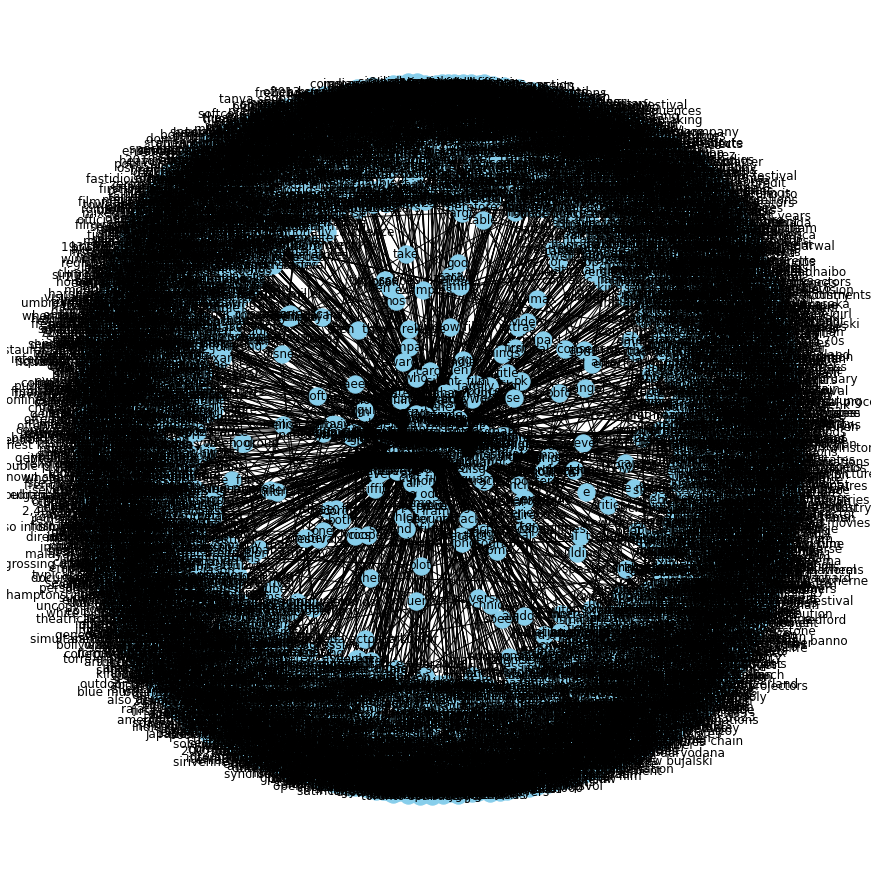
that took 2 minutes because there are a lot of relations to visualize, lets write a function to visualize a specific relation.
def plot_relation(relation):
    """
    Plot relationship between entities given relationship.

    Parameters
    ----------
    relation: string
        The relationship to plot in kg_df.
    """
    com_graph = nx.from_pandas_edgelist(kg_df[kg_df['edge']==relation], "source", "target",
                          edge_attr=True, create_using=nx.MultiDiGraph())

    plt.figure(figsize=(12,12))
    pos = nx.spring_layout(com_graph, k = 0.5) # k regulates the distance between nodes
    nx.draw(com_graph, with_labels=True, node_color='skyblue', node_size=1500, edge_cmap=plt.cm.Blues, pos= pos)
    plt.show()
# get most common relations
kg_df['edge'].value_counts()[:20]
is             370
was            297
released on     87
include         73
were            71
are             71
released        40
's              38
composed by     35
have            31
has             31
became          31
become          29
released in     27
included        26
produced        22
called          22
considered      20
made            20
had             20
Name: edge, dtype: int64
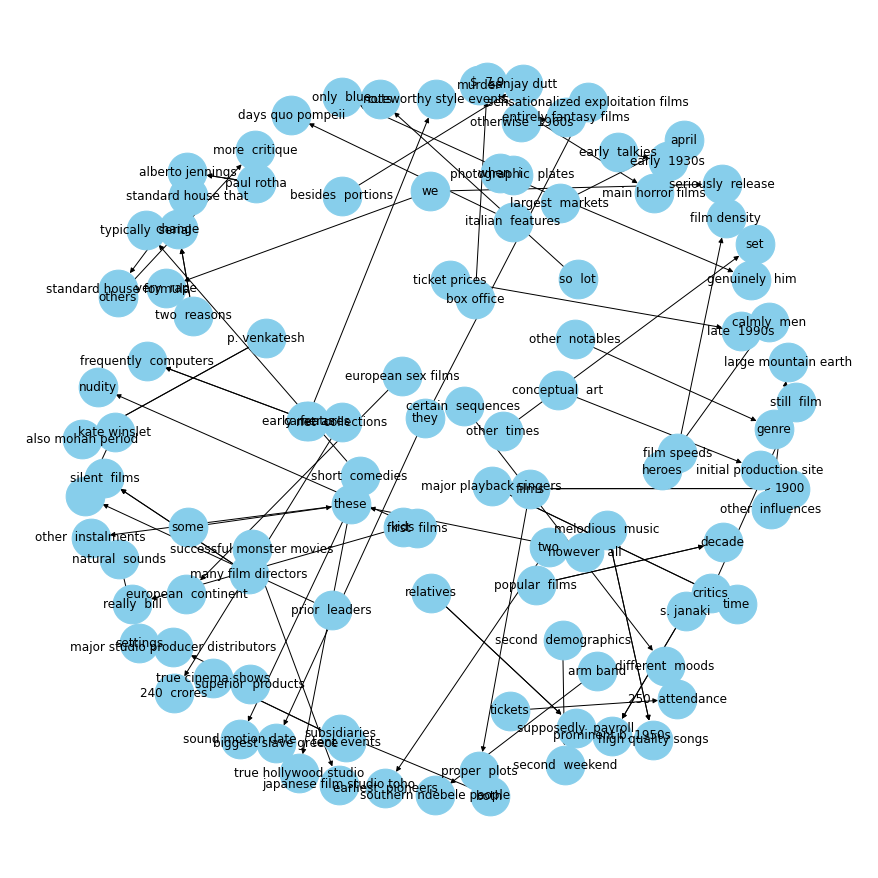
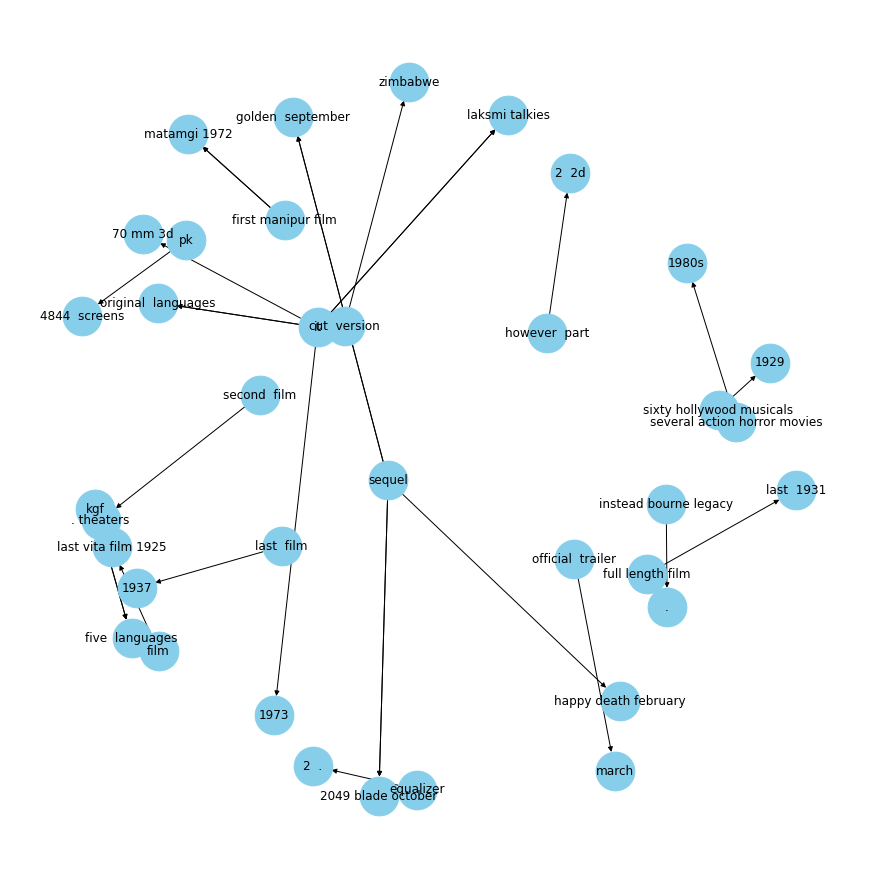
# plot some specific relations
plot_relation("were")
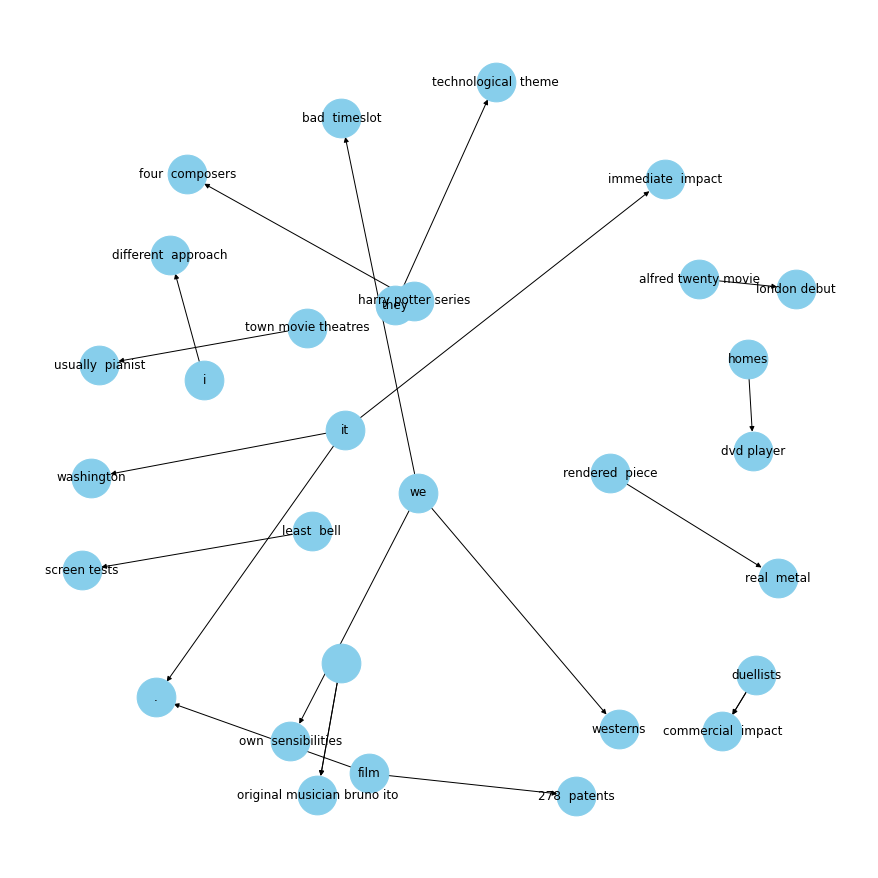
# plot some specific relations
plot_relation("had")
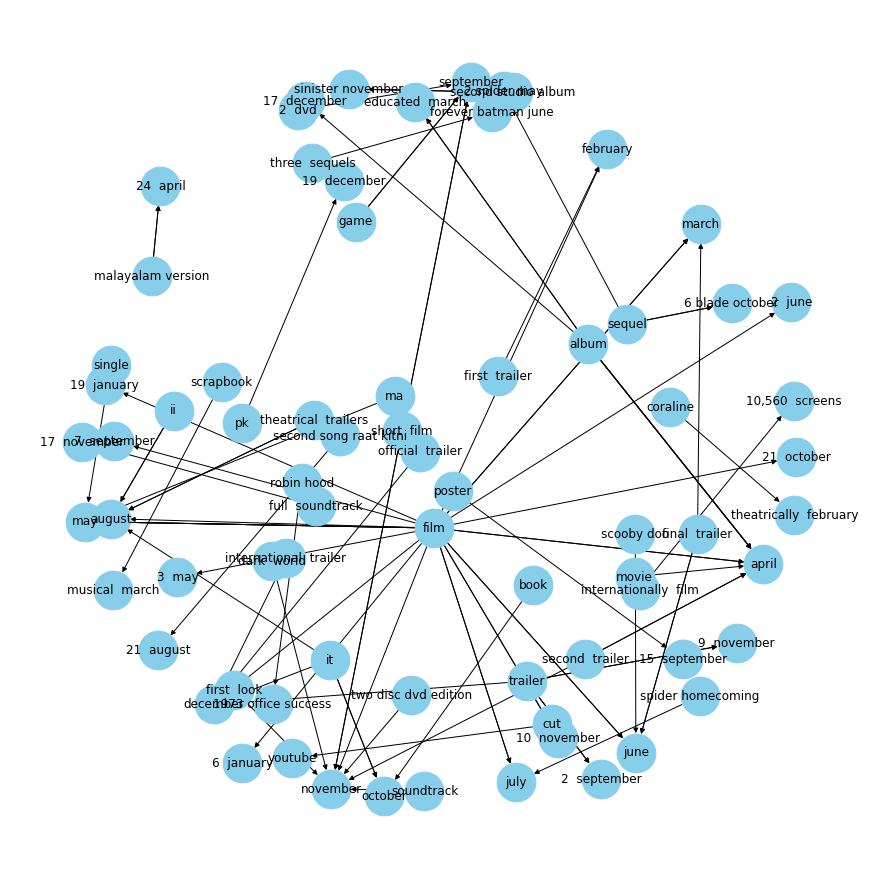
plot_relation("released in")
plot_relation("released on")
How to create a new novel datasets from a few set of images.

Data Science Project

A Decentralized Application that simulates a bank using blockchain
Data Science Project